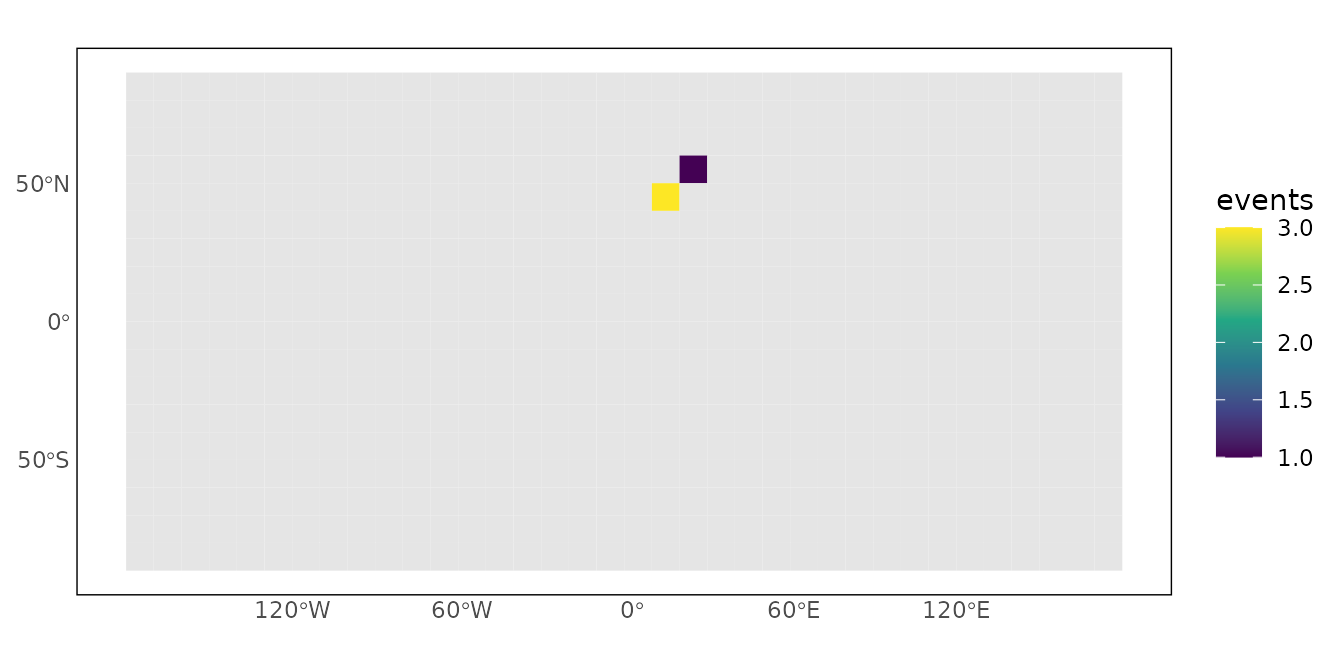
The foundation functions provide a consistent route from locations to
cells, from cells to geometries, and from incomplete observations to
analysis-ready PRIO-GRID panels. All functions accept a
priogrid configuration, so the same workflow can be used
with alternative resolutions and extents.
Convert coordinates and cell IDs
pg_id_from_coords() assigns longitude-latitude
coordinates to configured cells. Coordinates outside a regional grid
return NA by default.
cells <- pg_id_from_coords(
  longitude = c(10, 20),
  latitude = c(50, 60),
  config = config
)
cells
#> [1] 488 525
Cell centres can be recovered in any requested coordinate reference system.
pg_coords_from_id(cells, config = config)
#>   pgid xcoord ycoord
#> 1  488     15     45
#> 2  525     25     55
Create spatial geometries
Use pg_geometry() to create polygons for mapping or
points for distance and nearest-feature operations.
cell_polygons <- pg_geometry(cells, config = config)
cell_centres <- pg_geometry(cells, geometry = "point", config = config)
cell_centres
#> Simple feature collection with 2 features and 1 field
#> Geometry type: POINT
#> Dimension:     XY
#> Bounding box:  xmin: 15 ymin: 45 xmax: 25 ymax: 55
#> Geodetic CRS:  +proj=longlat +datum=WGS84 +no_defs
#>   pgid      geometry
#> 1  488 POINT (15 45)
#> 2  525 POINT (25 55)
Validate and complete data
Validation reports missing or unknown IDs, missing time values, duplicate panel keys, and—when requested—absent cell-time combinations.
observations <- data.frame(
  pgid = cells,
  year = c(2020L, 2020L),
  events = c(3L, 1L)
)

pg_validate_data(
  observations,
  time = "year",
  config = config
)
#> PRIO-GRID validation: valid
#> Rows: 2; observed cells: 2
#>                 check    severity   n
#>  missing_combinations information 646
pg_complete_panel() makes missing combinations explicit.
Fill values are applied only to rows created by the function; existing
NA values are left unchanged.
panel <- pg_complete_panel(
  observations,
  time = "year",
  cells = cells,
  times = 2020:2021,
  fill = list(events = 0L),
  config = config
)
panel
#>   pgid year events
#> 1  488 2020      3
#> 2  525 2020      1
#> 3  488 2021      0
#> 4  525 2021      0
Join variables safely
The default relationship is many-to-one: the right-hand table must contain at most one row for each inferred grid-time key. State another relationship only when it is substantively intended.
cell_attributes <- data.frame(
  pgid = cells,
  region = c("A", "B")
)

panel <- pg_join(panel, cell_attributes, by = "pgid")
panel
#>   pgid year events region
#> 1  488 2020      3      A
#> 2  525 2020      1      B
#> 3  488 2021      0      A
#> 4  525 2021      0      B